Introduction
If you've got a home lab with more than one or two machines, you've probably had that moment where you're wondering if a box is still alive, what the CPU is doing, or whether it's running hot. I got to that point with my setup — I've got a mix of Raspberry Pis and a couple of Ubuntu PCs on my local network, and I got tired of SSH-ing into each one just to check on things.
What I really wanted was something I could throw up on a screen — maybe a monitor or a TV in the corner — and just glance at to see how everything was doing. I looked at a few options, but most of them felt like overkill for what I needed. Prometheus and Grafana are great, but they're a lot of moving parts for a home lab. I just wanted something simple.
So I built it. If you want to skip straight to the code, here is the repo. Otherwise, let's walk through how to set it up.
How It Works
The system has two pieces. The first is a lightweight Python agent — metrics_agent.py — that
runs on every machine you want to monitor. It uses Python's psutil library to gather stats like
CPU usage, memory, and temperature, and exposes them over a simple HTTP endpoint on port 9100. No databases,
no brokers, nothing fancy.
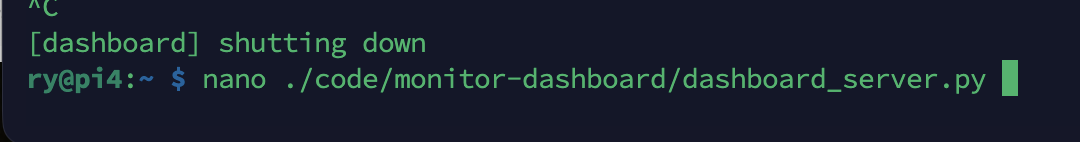
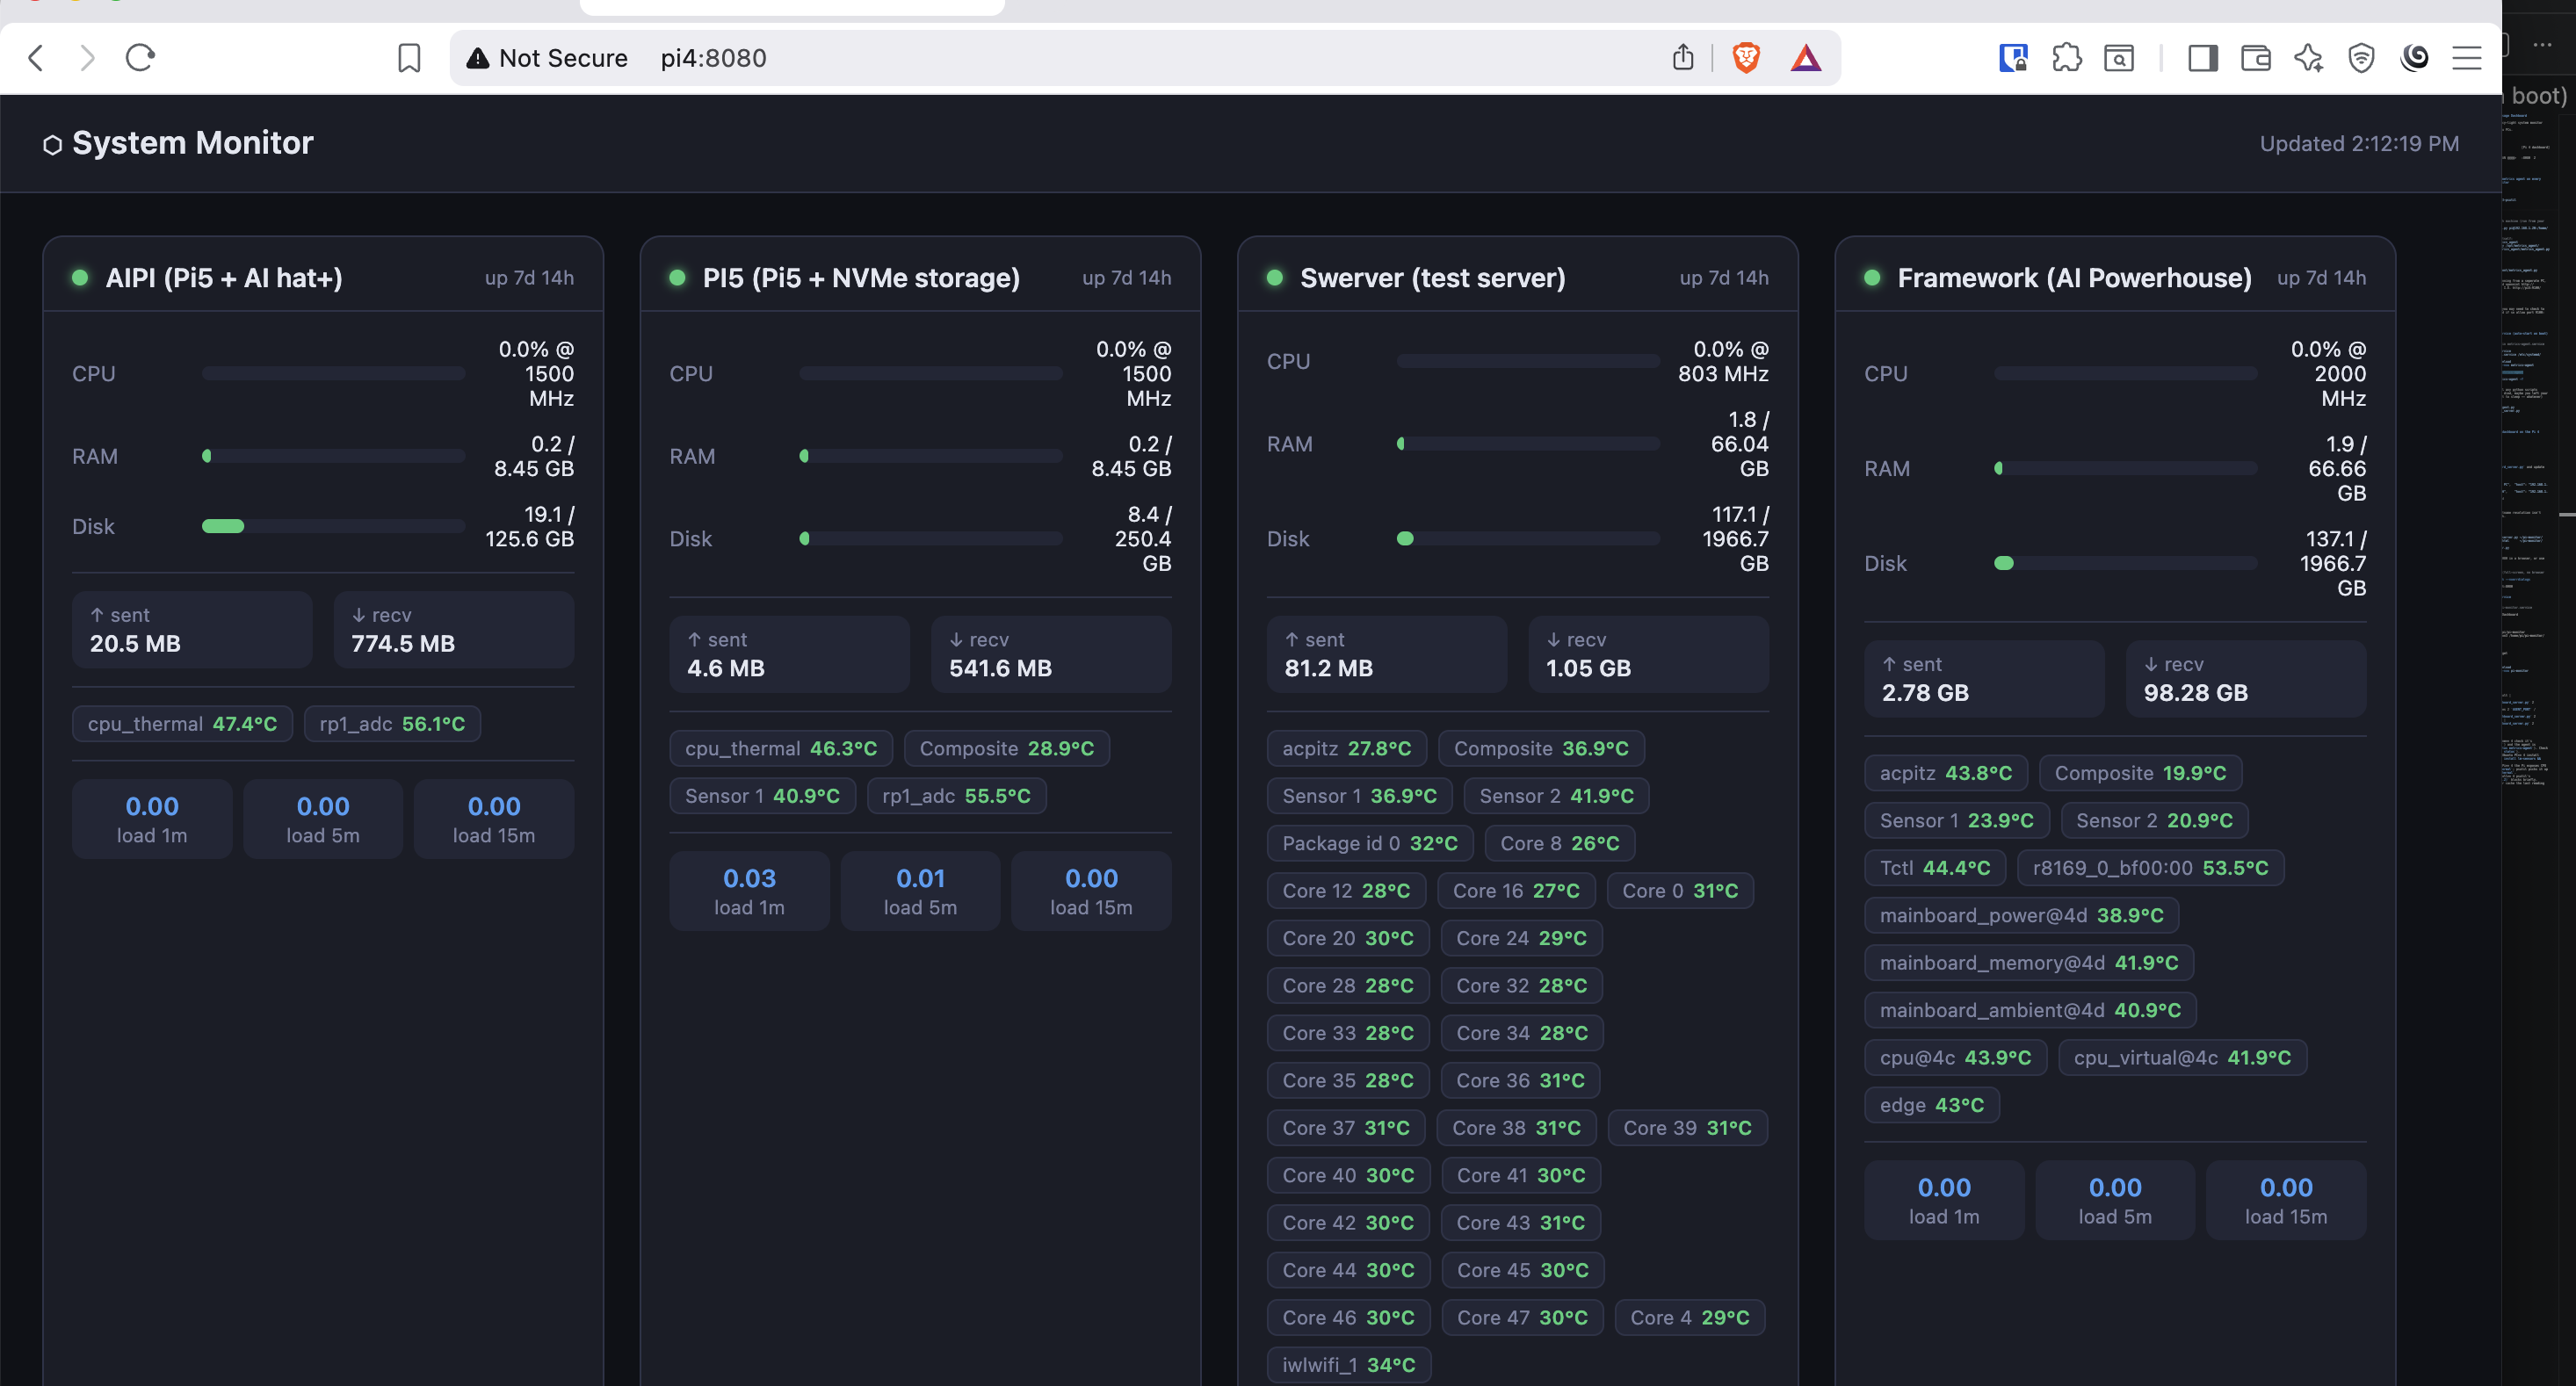
The second piece is the dashboard itself. A central machine (in my case a Raspberry Pi 4) runs
dashboard_server.py, which polls all the agents every 5 seconds and serves a web page at
port 8080. You can open that page in any browser, or throw it into Chromium's kiosk mode on the Pi and
have it fill a screen automatically.
I have this setup running on a Pi4 as the dashboard, where I also have the monitor. I'm also monitoring 2 pi 5's, 2 ubuntu servers, and I setup the code in a docker container and am using it to monitor system stats on my Unraid server as well. It's simple, and it works great. Let's get into the setup.
Part 1: The Metrics Agent
The agent needs to run on every machine you want to track. Start by installing the one dependency it needs:
bashsudo apt install python3-psutil
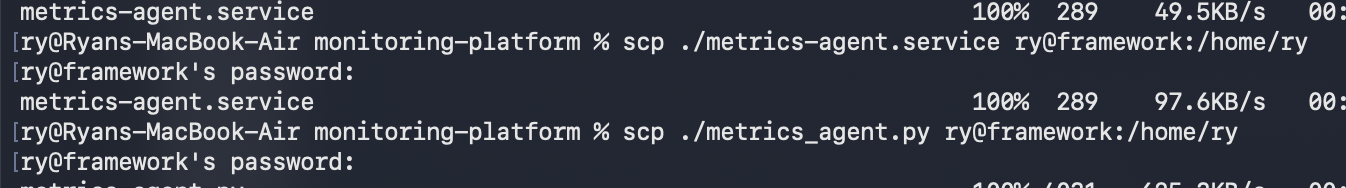
Then grab the agent script from the repo and copy it over to the machine. I used scp to push
it from my main machine to each Pi and server.
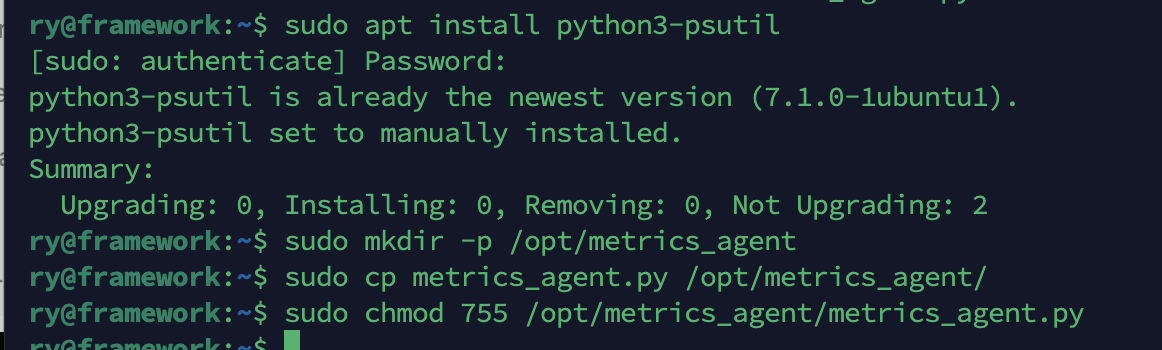
Once it's on the machine, move it into a consistent location and set the right permissions:
bashsudo mkdir -p /opt/metrics_agent
sudo cp metrics_agent.py /opt/metrics_agent/
sudo chmod 755 /opt/metrics_agent/metrics_agent.py

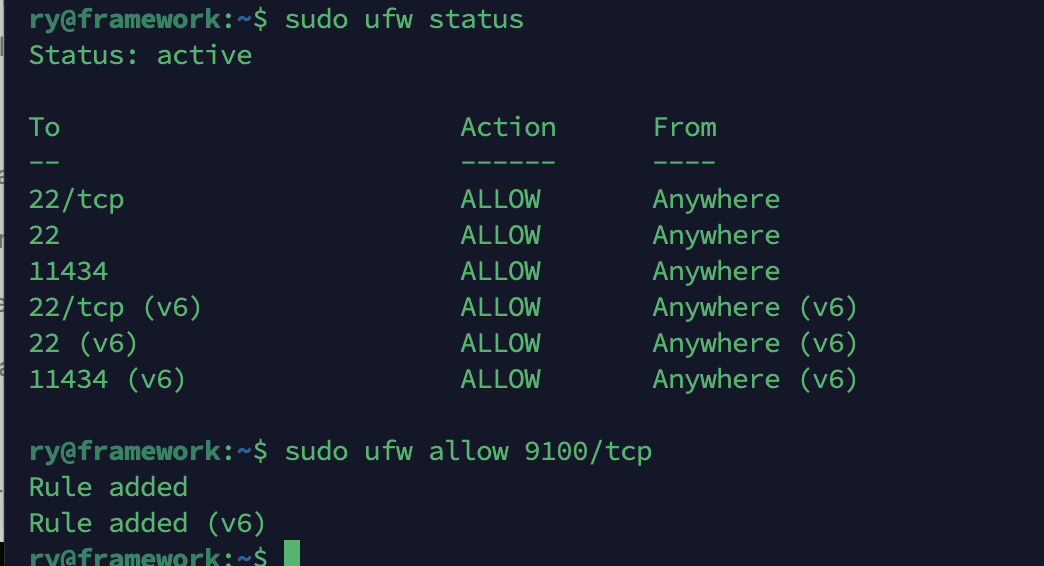
Next, if you have a firewall running on your machine, you need to open up that firewal. It's pretty easy, and with the port open the dashboard machine can actually reach the agent's port:
bashsudo ufw allow 9100/tcp
Testing the Agent
Before setting anything up as a service, it's worth running the agent manually just to make sure it works. SSH into the machine and run it directly:
bashpython3 /opt/metrics_agent/metrics_agent.py

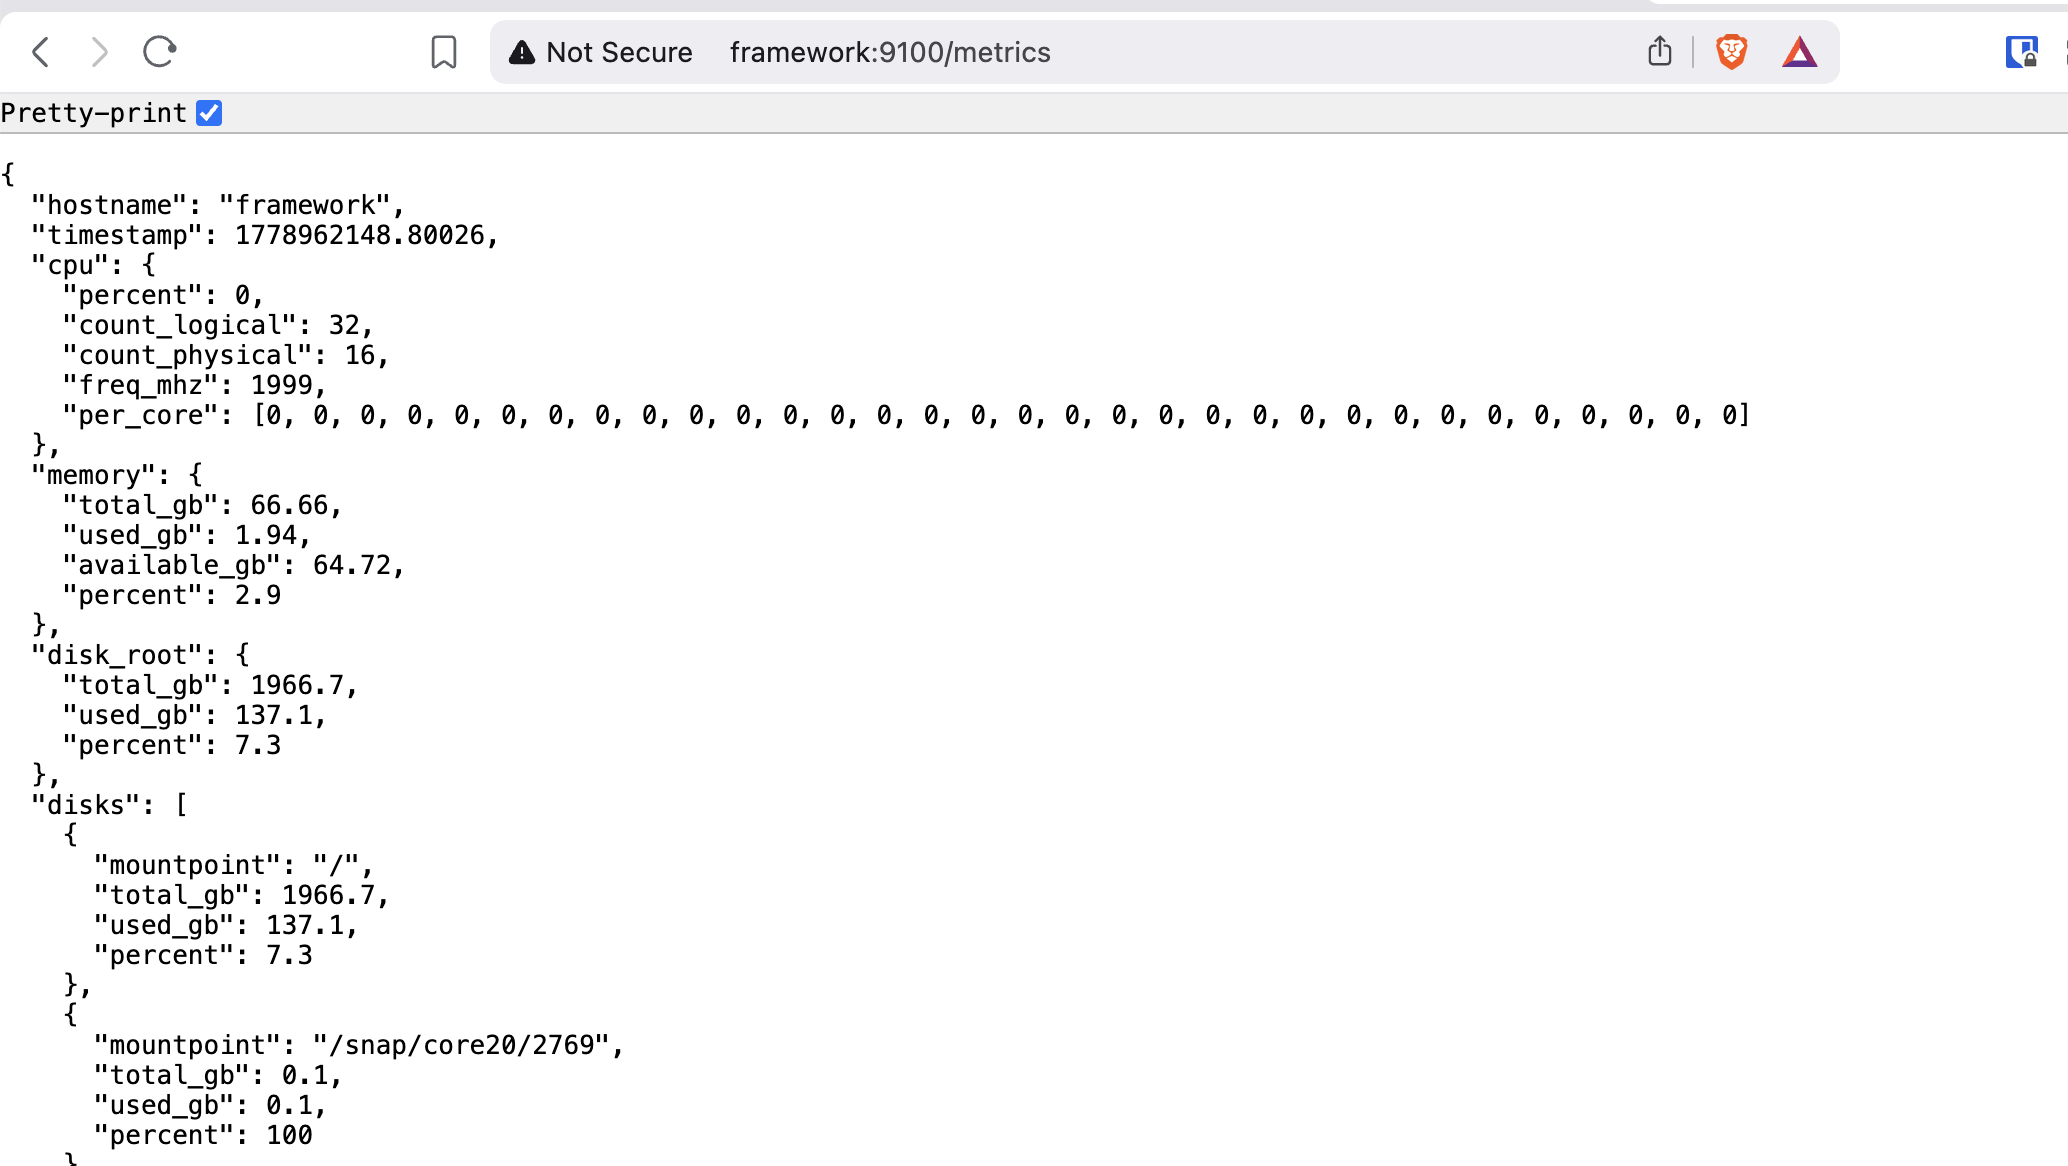
With the agent running, open a browser and hit http://HOSTNAME:9100/metrics. You should see a
raw response with the system stats.
Running the Agent as a Service
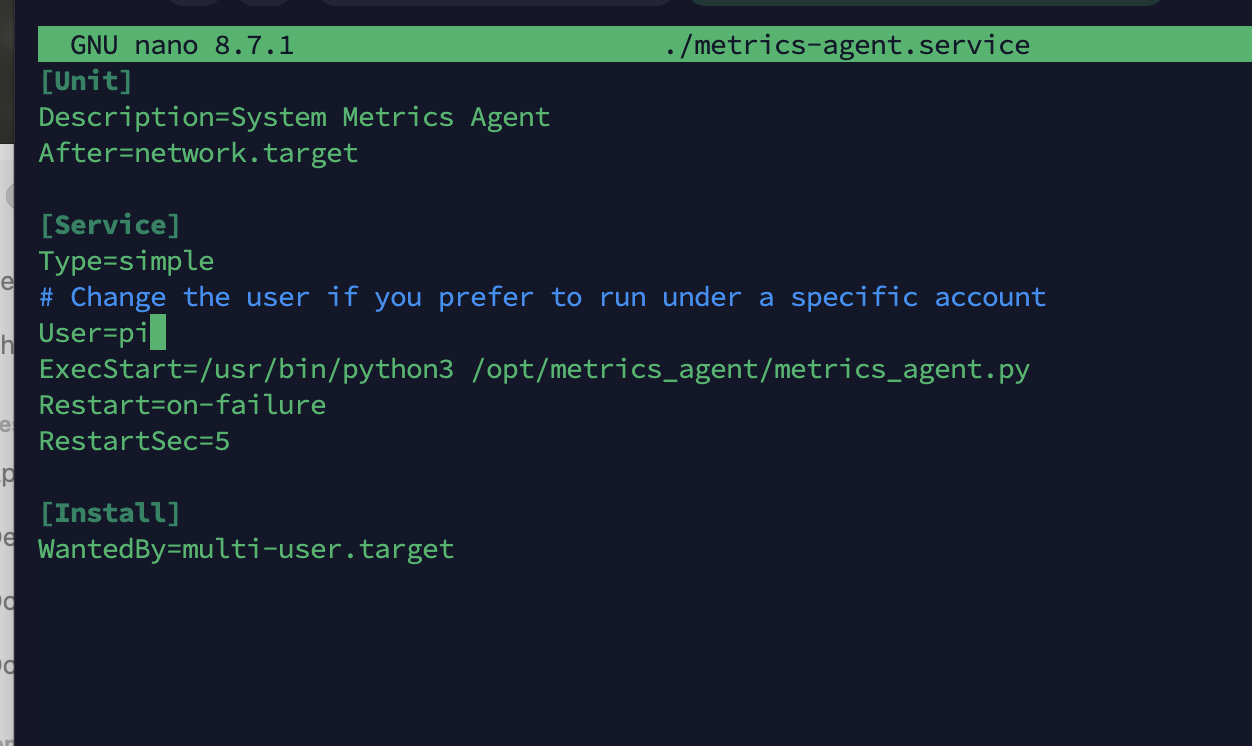
Once you've confirmed the agent works, you'll want it to start automatically on boot. The repo includes
a metrics-agent.service file for this. Open it up and check the User= line —
make sure it matches the user you want the agent to run as on that machine.
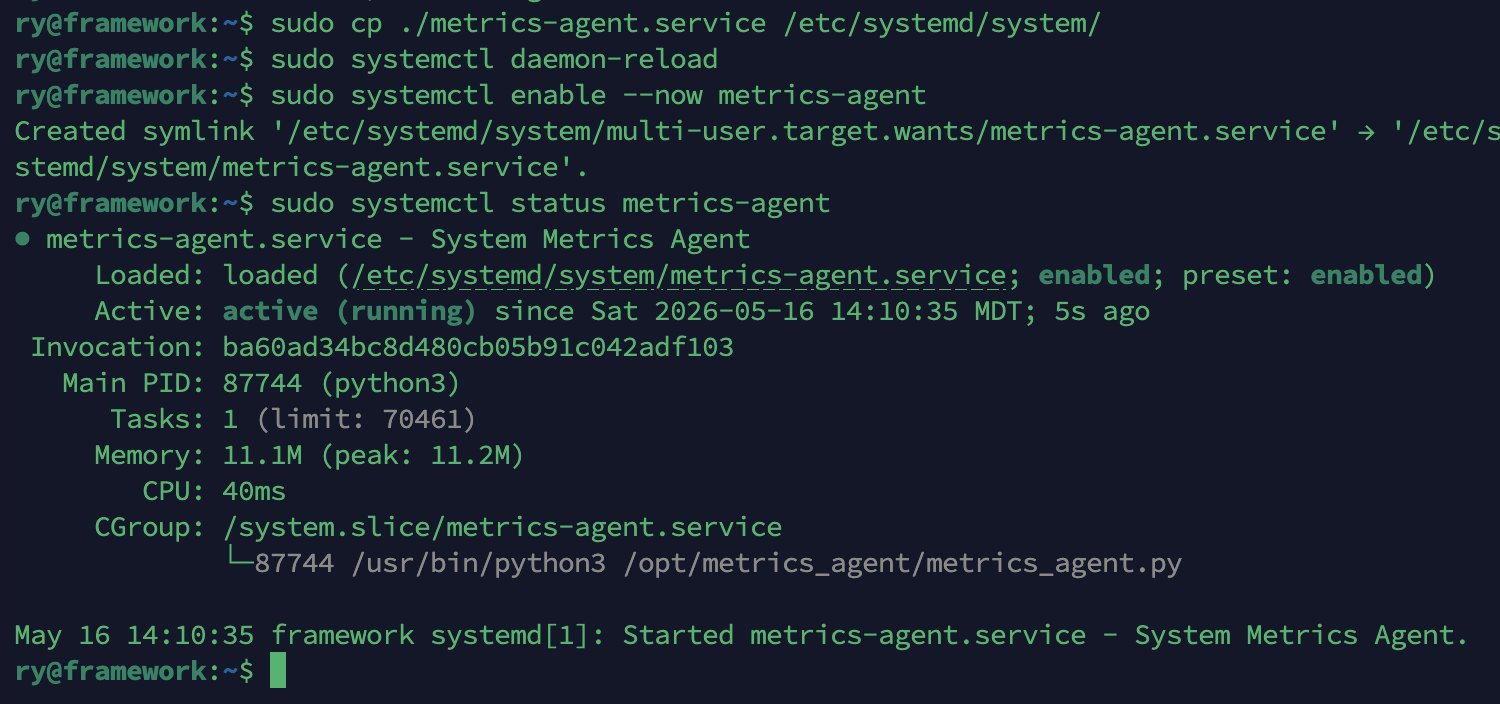
Then copy the service file into place and enable it:
bashsudo cp ./metrics-agent.service /etc/systemd/system/
sudo systemctl daemon-reload
sudo systemctl enable --now metrics-agent
sudo systemctl status metrics-agent
Repeat Part 1 on every machine you want to monitor. The whole process per machine is pretty quick once you've done it once.
Part 2: The Dashboard
The dashboard runs on a single machine — I used a Raspberry Pi 4, but any machine on your local network will work. Start by installing the one extra dependency it needs:
bashpip3 install requests
Then open dashboard_server.py and update the HOSTS list to point at all the
machines you just set up agents on. I'd recommend using IP addresses here rather than hostnames — mDNS
resolution can be flaky across different machine types on a local network.
pythonHOSTS = [
    {"name": "My Ubuntu PC",  "host": "192.168.1.10"},
    {"name": "Pi Zero 2W",    "host": "192.168.1.20"},
    # add more as needed
]
With that saved, copy the dashboard files into place and start the server:
bashmkdir -p ~/pi-monitor
cp dashboard/dashboard_server.py ~/pi-monitor/
cp dashboard/dashboard.html      ~/pi-monitor/
cd ~/pi-monitor
python3 dashboard_server.py

Open a browser on any machine on your network and navigate to http://DASHBOARD_IP:8080.
You should see all your machines showing up with live stats.
If you want to run this as a service (which I'd recommend so it survives reboots), the repo includes
a monitor.service file as well. Same process as the agent — update the User=
and WorkingDirectory= fields, copy it to /etc/systemd/system/, and enable it.
And if you're running it on a Pi with a display attached, you can throw Chromium into kiosk mode and have the dashboard fill the whole screen automatically on boot:
bashchromium-browser --kiosk --noerrdialogs --disable-infobars \
  --app=http://localhost:8080
A Few Notes
Temperature readings work out of the box on Raspberry Pis — psutil reads directly from
/sys/class/thermal. On Ubuntu machines you may need to install lm-sensors
first if temps aren't showing up:
bashsudo apt install lm-sensors && sudo sensors-detect
If a machine shows as offline in the dashboard, the usual suspects are the firewall (check that port 9100
is open), the agent service not running (systemctl status metrics-agent), or a flaky hostname
resolution (switch to the IP address in the HOSTS list if so).
Conclusion
That's really all there is to it. The whole thing is maybe 30–45 minutes of setup across your machines, and the result is a live dashboard you can leave up on a screen and actually trust. No cloud dependency, no heavy stack, no monthly bill. Just Python and a browser. If you build it, feel free to open an issue or PR on the repo — I'd love to see what other people do with it.